My mom wants to start her own clothing line. She asked me to design a label and a brand around the name "Agapanto", her favorite flower. Here is the result:


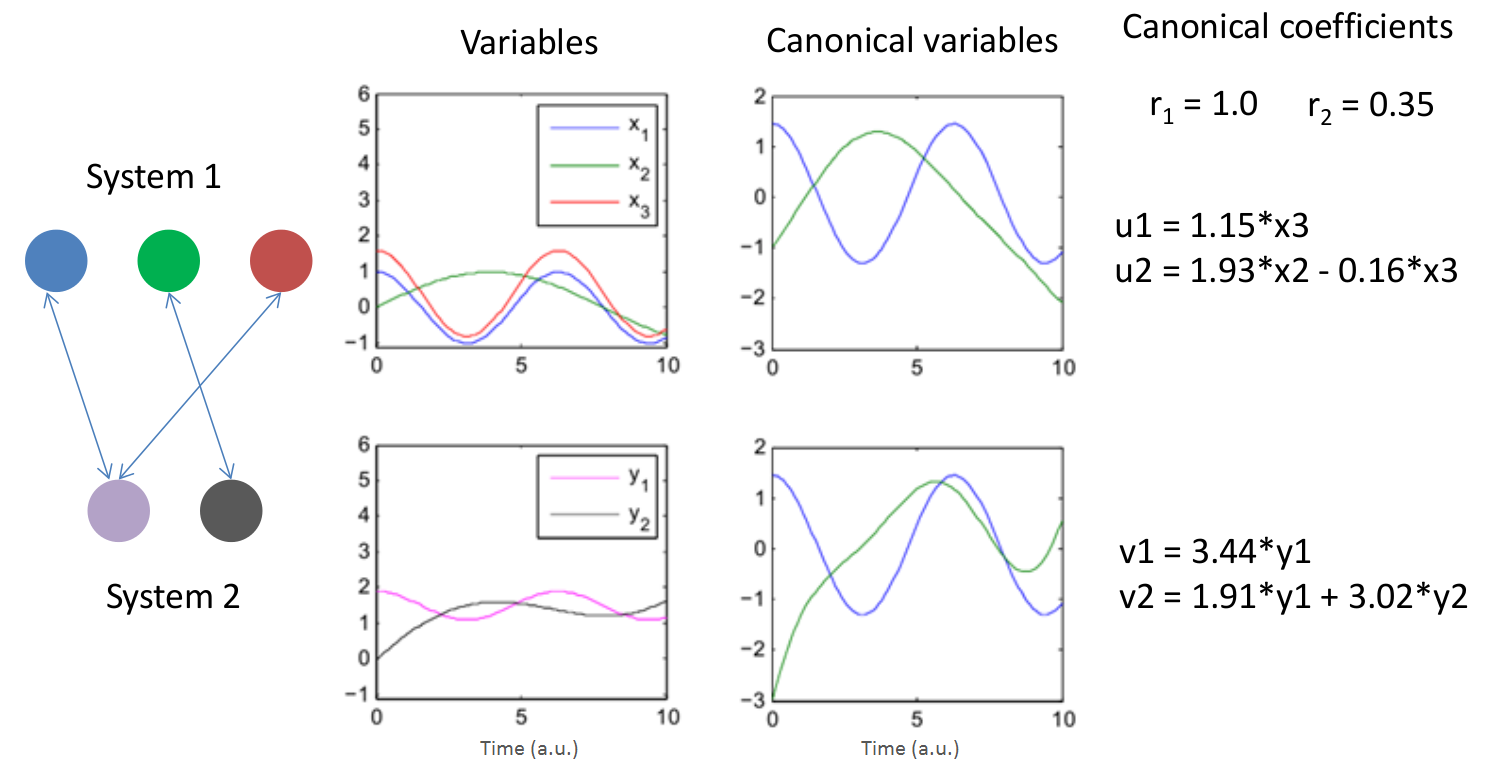
%% Create example canonical correlation plots in Matlab
% Build some simple signals with optional noise (s)
t = 0:0.1:10;
l = length(t);
s = 0;
X(:,1) = cos(t) + s*rand(1,l);
X(:,2) = sin(t/2.5) + s*rand(1,l);
X(:,3) = 1.2*cos(t) + 0.4 + s*rand(1,l) + t*0.0;
Y(:,1) = 0.4*cos(t) + 1.5 + s*rand(1,l);
Y(:,2) = sin(t/2.2+0.4) - 0.4 + t*0.3 + s*rand(1,l);
% Plot signals over time
figure(1)
subplot(2,2,1); plot(t,X); ylim([-1.1 6])
legend('x_1','x_2','x_3')
subplot(2,2,3); plot(t,Y(:,1),'m',t,Y(:,2),'k'); ylim([-1.1 6])
legend('y_1','y_2')
% It is usually prudent to check the rank, just display it
rank(X)
rank(Y)
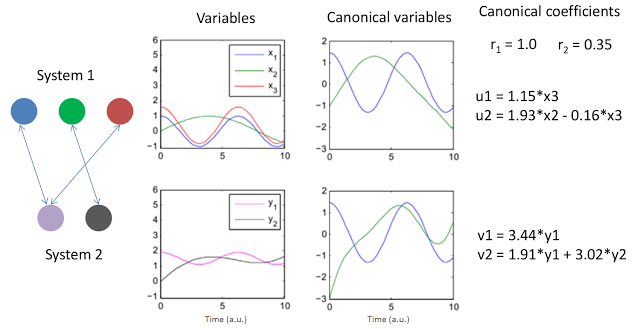
% Perform CCA using Matlabs function
[A,B,r,U,V] = canoncorr(X,Y);
% Just print out results
A,B,r
subplot(2,2,2); plot(t,U); ylim([-3 2])
subplot(2,2,4); plot(t,V); ylim([-3 2])
%% Plot canonical variables
figure(2); clf;
subplot(2,1,1); hold all; plot(t,X*A); plot(t,U);
subplot(2,1,2); hold all; plot(t,Y*B); plot(t,V);
%% Plot signals against each other
figure(3)
subplot(3,2,1); plot(X(:,1),Y(:,1),'k.')
subplot(3,2,3); plot(X(:,2),Y(:,1),'k.')
subplot(3,2,5); plot(X(:,3),Y(:,1),'k.')
subplot(3,2,2); plot(X(:,1),Y(:,2),'k.')
subplot(3,2,4); plot(X(:,2),Y(:,2),'k.')
subplot(3,2,6); plot(X(:,3),Y(:,2),'k.')
% Some information about their correlations
p = corrcoef([X Y]);
p = p(1:3,4:5)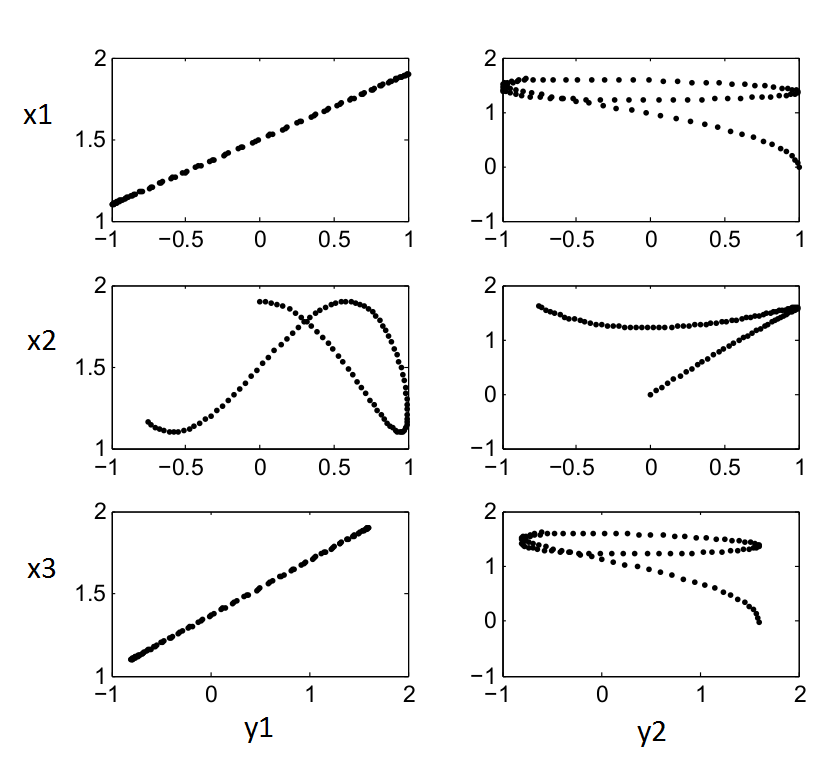


#!/bin/bash
# update.sh: Update the blog. Saved as .sh so Windows recognizes
# it as an executable script.

# Delete previous version files, later git will only upload
# changed files from HTTrack's copy
cd pepgma.github.io/
rm -rf *.html css ico jpg js other png

# Update mirror using HTTrack, do not ask to update, just
# do it
cd ../codedelicias.blogspot.de/
../httrack-noinst-3.48.19/httrack.exe --quiet --update

# Copy files to repository folder
cd web/
cp -r *.html css ico jpg js other png ../../pepgma.github.io/

# Go to repository
cd ../../pepgma.github.io/

# # Enable this section only if you have to do some modifications to the mirrored
# # files. In the Blogger case some links in static json queries are broken.
# # I used sed to fix them.
# # Note This produces a warning that can be fixed:
# # http://stackoverflow.com/questions/14313318/permission-denied-when-sed-in-place-edit-in-mingw
# cd other/
# URL='http:\\/\\/codedelicias\.blogspot\.com\\/20..\\/..\\/'
# sed -i 's|'$URL'||g' *
# cd ..

# Synchronize mirror with GitHub pages
git add --all
git commit -m "Update"
git push

# See result and wait to finish
read -n1 -r -p "Press any key to finish..."


sudo yum install epel-releasesudo yum install ansibleansible --version


