This is a simple compilation and a taxonomy attempt of Python plotting libraries. This is focused on web alternatives that can be combined with iPython Notebook but at least one is desktop based. I used Python for most of my dissertation writing and now, during my Postdoc, the time to produce pretty publication plots is near. The list adds some details of the project as reported by its GitHub repo. This builds upon Nathan Lemoine's post.
Matplotlib: 14,758 commits, 4 branches, 43 releases, 360 contributors, Jul 12, 2015
Holoviews: 3,860 commits, 4 branches, 10 releases, 9 contributors, Jul 11, 2015
Seaborn: 1,378 commits, 10 branches, 9 releases, 38 contributors, Jul 10, 2015
ggplot: 731 commits, 3 branches, 0 releases, 40 contributors, Jun 11, 2015
mpld3: 540 commits, 13 branches, 1 releases, 27 contributors, Jul 6, 2015
Prettyplotlib: 252 commits, 5 branches, 0 releases, 21 contributors, Oct 6, 2014
Alternatives independent of Matplotlib based on d3:
plot.ly: 1,215 commits 26 branches 4 releases 8 contributors Jul 10, 2015
Vincent: 419 commits, 2 branches, 8 releases, 23 contributors, Jan 28, 2015
d3py: 161 commits, 3 branches, 0 releases, 8 contributors, Feb 7, 2014
Alternatives independent of Matplotlib:
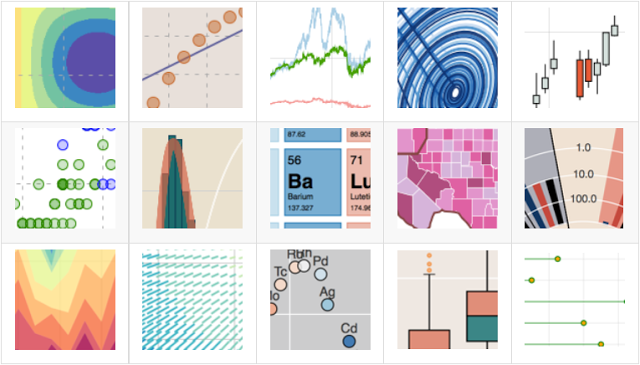
Bokeh: 9,161 commits, 29 branches, 51 releases, 98 contributors, Jul 10, 2015
Veusz: 2,615 commits, 13 branches, 39 releases, 14 contributors, Jul 11, 2015
Python-highchart: 139 commits, 3 branches, 13 releases, 4 contributors, Jul 6, 2015
Image: Bokeh

