Showing posts with label tools. Show all posts

Canonical correlation analysis (CCA) is a tool to find relations among two sets of random variables. The result of CCA is a new pair of sets of random variables, the canonical variables, which represent potential linear relations between the original sets. As a tool to analyze the relation between two signals or time domain systems, CCA is a powerful method to discover intrinsic linear relations between the two systems.

A few days ago I had to understand how CCA works for a presentation and found relatively little information online, and almost no simple examples that I could use to visualize it. At the end it resulted to be a rather simple concept. Here I present a simple example with artificial signals I designed for my presentation.

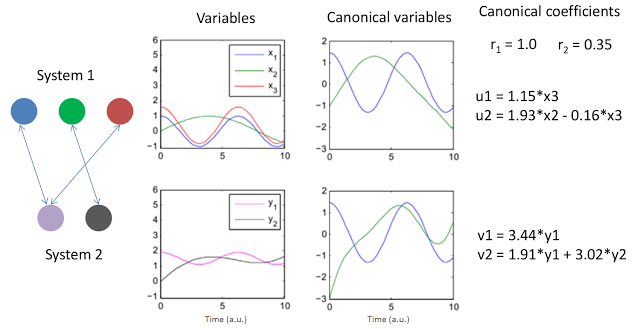
The above figure presents two simple systems and the resulting canonical variables and coefficients. The signals were conveniently created to display simple linear relations. Note that x1 and x3 are basically just a scaled version of y1 so one would expect a high correlation among them and potentially a canonical variable would explain that. The variables x2 and y2 also exhibit a relation but this time a rather weak one. The graph to the left represents this relationships with arrows. Note that CCA allows to compare sets with different numbers of variables, just another beauty of the method.

The results of CCA for this example are shown no the right of the above figure. The two canonical coefficients show the "strength" of the relations between the two sets (the method produces two i.e. the minimum between the number of elements of the two sets: 2 vs 3). The two pairs of canonical "systems": (u1, u2) and (v1, v2) represent the linear combinations of variables of each system in the form they produce the strongest correlations among the original sets (x's and y's). As such they can be written as linear equations from the original variables.

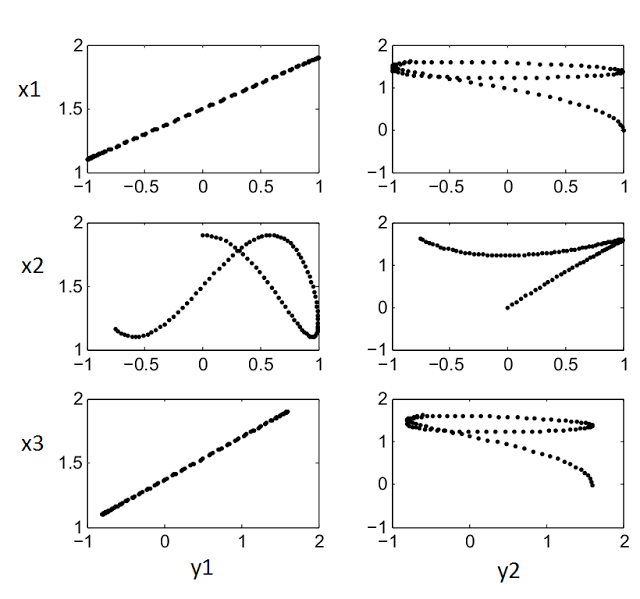
The Matlab code below was used to produce the figures above. Another for to visualize the relations between the variables is to plot all possible combinations of variables as scatter plots (x's vs y's). That plot is shown after the code.

%% Create example canonical correlation plots in Matlab

% Build some simple signals with optional noise (s)
t = 0:0.1:10;
l = length(t);
s = 0;
X(:,1) = cos(t) + s*rand(1,l);
X(:,2) = sin(t/2.5) + s*rand(1,l);
X(:,3) = 1.2*cos(t) + 0.4 + s*rand(1,l) + t*0.0;

Y(:,1) = 0.4*cos(t) + 1.5 + s*rand(1,l);
Y(:,2) = sin(t/2.2+0.4) - 0.4 + t*0.3 + s*rand(1,l);

% Plot signals over time
figure(1)
subplot(2,2,1); plot(t,X); ylim([-1.1 6])
legend('x_1','x_2','x_3')
subplot(2,2,3); plot(t,Y(:,1),'m',t,Y(:,2),'k'); ylim([-1.1 6])
legend('y_1','y_2')

% It is usually prudent to check the rank, just display it
rank(X)
rank(Y)

% Perform CCA using Matlabs function
[A,B,r,U,V] = canoncorr(X,Y);

% Just print out results
A,B,r

subplot(2,2,2); plot(t,U); ylim([-3 2])
subplot(2,2,4); plot(t,V); ylim([-3 2])

%% Plot canonical variables 
figure(2); clf; 
subplot(2,1,1); hold all; plot(t,X*A); plot(t,U);
subplot(2,1,2); hold all; plot(t,Y*B); plot(t,V);

%% Plot signals against each other
figure(3)
subplot(3,2,1); plot(X(:,1),Y(:,1),'k.')
subplot(3,2,3); plot(X(:,2),Y(:,1),'k.')
subplot(3,2,5); plot(X(:,3),Y(:,1),'k.')
subplot(3,2,2); plot(X(:,1),Y(:,2),'k.')
subplot(3,2,4); plot(X(:,2),Y(:,2),'k.')
subplot(3,2,6); plot(X(:,3),Y(:,2),'k.')

% Some information about their correlations
p = corrcoef([X Y]);
p = p(1:3,4:5)

The scatter plot for figure(3):

This is a simple compilation and a taxonomy attempt of Python plotting libraries. This is focused on web alternatives that can be combined with iPython Notebook but at least one is desktop based. I used Python for most of my dissertation writing and now, during my Postdoc, the time to produce pretty publication plots is near. The list adds some details of the project as reported by its GitHub repo. This builds upon Nathan Lemoine's post.
Maplotlib and Matplotlib improvements:

Matplotlib: 14,758 commits, 4 branches, 43 releases, 360 contributors, Jul 12, 2015
Holoviews: 3,860 commits, 4 branches, 10 releases, 9 contributors, Jul 11, 2015
Seaborn: 1,378 commits, 10 branches, 9 releases, 38 contributors, Jul 10, 2015
ggplot: 731 commits, 3 branches, 0 releases, 40 contributors, Jun 11, 2015
mpld3: 540 commits, 13 branches, 1 releases, 27 contributors, Jul 6, 2015
Prettyplotlib: 252 commits, 5 branches, 0 releases, 21 contributors, Oct 6, 2014

Alternatives independent of Matplotlib based on d3:

plot.ly: 1,215 commits 26 branches 4 releases 8 contributors Jul 10, 2015
Vincent: 419 commits, 2 branches, 8 releases, 23 contributors, Jan 28, 2015
d3py: 161 commits, 3 branches, 0 releases, 8 contributors, Feb 7, 2014

Alternatives independent of Matplotlib:

Bokeh: 9,161 commits, 29 branches, 51 releases, 98 contributors, Jul 10, 2015
Veusz: 2,615 commits, 13 branches, 39 releases, 14 contributors, Jul 11, 2015
Python-highchart: 139 commits, 3 branches, 13 releases, 4 contributors, Jul 6, 2015

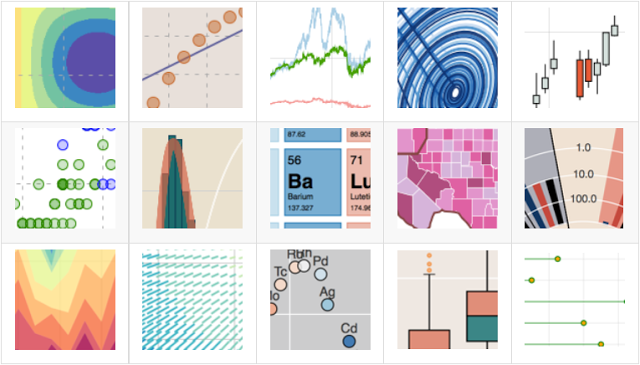
Image: Bokeh


GitHub pages has its own site generator besides the myriad of static generator alternatives. Still there are plenty of dynamic site generators that make the life of the content creator simpler. As long as the site is not too complex several tools exist to convert any website to a static one. One of such tools is HTTrack which can automate the process of downloading the site and resolving the links to a local static copy. Here I provide a bash script (usable in Windows thanks to msysgit's shell emulator) to run HTTrack to download a fresh copy of the website and push it to GitHub.

For this example an HTTrack profile for your website needs to be created first using the HTTrack GUI. In this example the profile is available on the local folder codedelicias.blogspot.de/ inside the main folder (where the script resides). Make sure this contains a sub-folder called hts-cache/ which is created by HTTrack. You will have to play with HTTtrack to find the best way to download your site and keep the links. In my case I just enabled Html in web, images/other in web/xxx where xxx is the file extension on the Build > local structure settings to keep files more organized. In this example a Non-Instal copy of HTTTrack is available also on the main folder.

The local git hub repository is on the folder pepgma.github.io/ inside the main folder.

I used Blogger as the dynamic site generator. You will have to try for your own with other services/applications. The script I use to update GitHub pages is:

#!/bin/bash
# update.sh: Update the blog. Saved as .sh so Windows recognizes
# it as an executable script.

# Delete previous version files, later git will only upload
# changed files from HTTrack's copy
cd pepgma.github.io/
rm -rf *.html css ico jpg js other png

# Update mirror using HTTrack, do not ask to update, just
# do it
cd ../codedelicias.blogspot.de/
../httrack-noinst-3.48.19/httrack.exe --quiet --update

# Copy files to repository folder
cd web/
cp -r *.html css ico jpg js other png ../../pepgma.github.io/

# Go to repository
cd ../../pepgma.github.io/

# # Enable this section only if you have to do some modifications to the mirrored 
# # files. In the Blogger case some links in static json queries are broken.
# # I used sed to fix them.
# # Note This produces a warning that can be fixed:
# # http://stackoverflow.com/questions/14313318/permission-denied-when-sed-in-place-edit-in-mingw
# cd other/
# URL='http:\\/\\/codedelicias\.blogspot\.com\\/20..\\/..\\/'
# sed -i 's|'$URL'||g' *
# cd ..

# Synchronize mirror with GitHub pages
git add --all
git commit -m "Update"
git push

# See result and wait to finish
read -n1 -r -p "Press any key to finish..."

To create a system diagram at work I tried to use Power Point but found that an important feature, the ability to add a label to a graph transition, was missing. I decided (as usual) to go online and spend a good amount of time to compare diagramming tools. This is a mini review of the compared apps and my decision

To start with I went to AlternativeTo looking for Gliffy, which was one of the suggestions Google gave me after looking for diagramming tools. AlternativeTo showed me among others, these:

Dia

Very well rated in AlternativeTo but seems it is not often updated anymore and GTK apps don’t work so well in my WIndows instalation.

yEd

Looks nice and OS portable (Java based) but seems to have restricted drawing capabilities seems to me the developers want to keep the software as a graph based tool and free connectors don’t exist in this world. Connector labelling is also a bit awkward.

draw.io

Although I am not particularly inclined to online apps, they keep getting faster and more responsive. Online apps are also the best way to find fresh and actively developed free applications today. draw.io seems to very well accept that users want to keep things private and allows some sort of offline storage. The app looks nice although not as nice as the other online contenders. A plus for looking like Google docs and connecting with Google drive.

Lucidchart

I remembered this from another of my software searches I did for interactive mockups. Someone was recommending it to do some sort of link based mockup if I remember correctly. This one looks great and allows connector labelling as all the others but the restricted capabilities for free users (including 60 objects max.) was a major downside for my specific requirements.

Gliffy

Also looks great and seems to enable plenty of diagram types. Big problem is the restriction to only 5 diagrams for free users and ‘NO PRIVATE DIAGRAMS’, what!?. Okey, it is free and they off course what to support the development but got me not to try it also.

This was just a personal review. I decided to go with draw.io.

To help my sister with her math homework (we live in different countries) I have been looking for a collaborative drawing tool where I can draw and write simple fractions while we talk over Skype. Here are a few options (as of August 2012):

http://docs.google.com/: No math, many shapes, shapes are hard to modify.
http://dabbleboard.com/: Has math, drawing libraries, shape detection.
http://scriblink.com/: Has math.
http://www.kerpoof.com/: Kids oriented.
http://cosketch.com/: Interesting text adding.
http://flockdraw.com/: Cute but simple.
http://awwapp.com/: Cute but simple.

Other lists:
http://www.pearltrees.com/viabf/boards-white-smart-ones/id5787731