Canonical correlation analysis (CCA) is a tool to find relations among two sets of random variables. The result of CCA is a new pair of sets of random variables, the canonical variables, which represent potential linear relations between the original sets. As a tool to analyze the relation between two signals or time domain systems, CCA is a powerful method to discover intrinsic linear relations between the two systems.
A few days ago I had to understand how CCA works for a presentation and found relatively little information online, and almost no simple examples that I could use to visualize it. At the end it resulted to be a rather simple concept. Here I present a simple example with artificial signals I designed for my presentation.
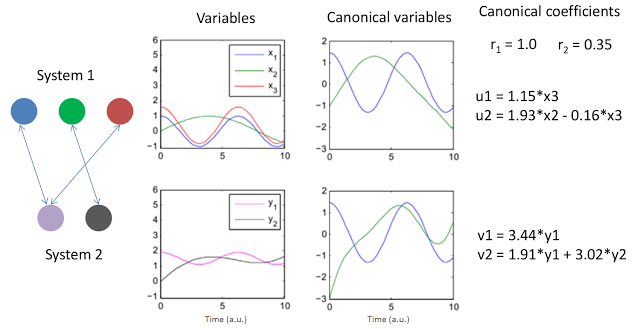
The above figure presents two simple systems and the resulting canonical variables and coefficients. The signals were conveniently created to display simple linear relations. Note that x1 and x3 are basically just a scaled version of y1 so one would expect a high correlation among them and potentially a canonical variable would explain that. The variables x2 and y2 also exhibit a relation but this time a rather weak one. The graph to the left represents this relationships with arrows. Note that CCA allows to compare sets with different numbers of variables, just another beauty of the method.
The results of CCA for this example are shown no the right of the above figure. The two canonical coefficients show the "strength" of the relations between the two sets (the method produces two i.e. the minimum between the number of elements of the two sets: 2 vs 3). The two pairs of canonical "systems": (u1, u2) and (v1, v2) represent the linear combinations of variables of each system in the form they produce the strongest correlations among the original sets (x's and y's). As such they can be written as linear equations from the original variables.
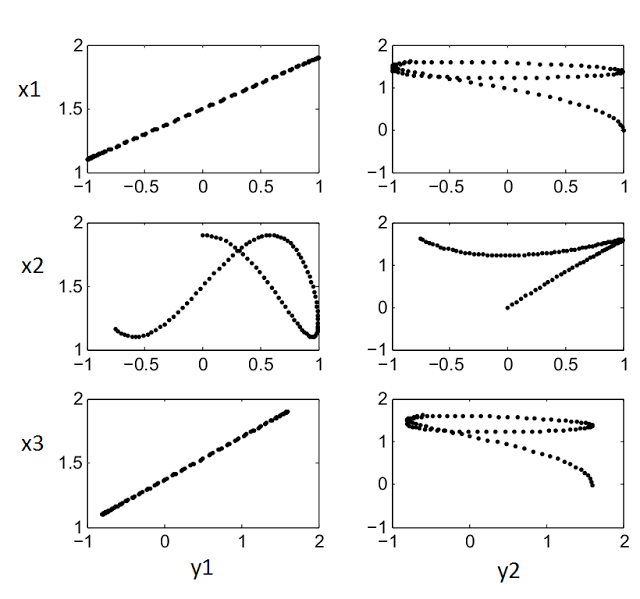
The Matlab code below was used to produce the figures above. Another for to visualize the relations between the variables is to plot all possible combinations of variables as scatter plots (x's vs y's). That plot is shown after the code.
%% Create example canonical correlation plots in Matlab

% Build some simple signals with optional noise (s)
t = 0:0.1:10;
l = length(t);
s = 0;
X(:,1) = cos(t) + s*rand(1,l);
X(:,2) = sin(t/2.5) + s*rand(1,l);
X(:,3) = 1.2*cos(t) + 0.4 + s*rand(1,l) + t*0.0;

Y(:,1) = 0.4*cos(t) + 1.5 + s*rand(1,l);
Y(:,2) = sin(t/2.2+0.4) - 0.4 + t*0.3 + s*rand(1,l);

% Plot signals over time
figure(1)
subplot(2,2,1); plot(t,X); ylim([-1.1 6])
legend('x_1','x_2','x_3')
subplot(2,2,3); plot(t,Y(:,1),'m',t,Y(:,2),'k'); ylim([-1.1 6])
legend('y_1','y_2')

% It is usually prudent to check the rank, just display it
rank(X)
rank(Y)

% Perform CCA using Matlabs function
[A,B,r,U,V] = canoncorr(X,Y);

% Just print out results
A,B,r

subplot(2,2,2); plot(t,U); ylim([-3 2])
subplot(2,2,4); plot(t,V); ylim([-3 2])

%% Plot canonical variables
figure(2); clf;
subplot(2,1,1); hold all; plot(t,X*A); plot(t,U);
subplot(2,1,2); hold all; plot(t,Y*B); plot(t,V);

%% Plot signals against each other
figure(3)
subplot(3,2,1); plot(X(:,1),Y(:,1),'k.')
subplot(3,2,3); plot(X(:,2),Y(:,1),'k.')
subplot(3,2,5); plot(X(:,3),Y(:,1),'k.')
subplot(3,2,2); plot(X(:,1),Y(:,2),'k.')
subplot(3,2,4); plot(X(:,2),Y(:,2),'k.')
subplot(3,2,6); plot(X(:,3),Y(:,2),'k.')

% Some information about their correlations
p = corrcoef([X Y]);
p = p(1:3,4:5)
The scatter plot for figure(3):


